Growing Urban AI/AN Communities: Preliminary Impressions from the Decennial Census
On August 12th 2021, the US Census Bureau released to the public Decennial Census P.L. 94-171 Redistricting Data Summary Files , a crucial resource for legislative redistricting. These data are now available for easy visualization by the public. The data show a growing nation, increasing 9% since 2010. In comparison, the population that identifies as American Indian or Alaska Native (AI/AN) alone or in combination with other races has increased 85%: from 5.2 million in 2010 to 9.7 million in 2020. The Census notes is that increases in many racial groups, including the AI/AN population, was driven by growth in multi-racial categories.
To explore these claims in more detail, NCUIH downloaded this data and compared it to the last decennial census. The AI/AN population grew substantially in both rural and urban settings compared to the general population, though urban populations increased the most. The Urban AI/AN population increased by 93%, compared to a 31% increase in rural areas. According to the redistricting data from the 2020 census, there are now 8.8 million AI/AN people living in urban areas.
NCUIH also analyzed the growth of urban AI/AN populations by Core Base Statistical Area to see in which cities the urban AI/AN population has grown the most. The Office of Management and Budget defines Core Base Statistical Areas (CBSA) as one or more counties with at least one urban core of at least 10,000 population, with a high degree of social and economic integration in order to conduct nationally consistent delineation for collection, tabulation and publication of geographic statistics.
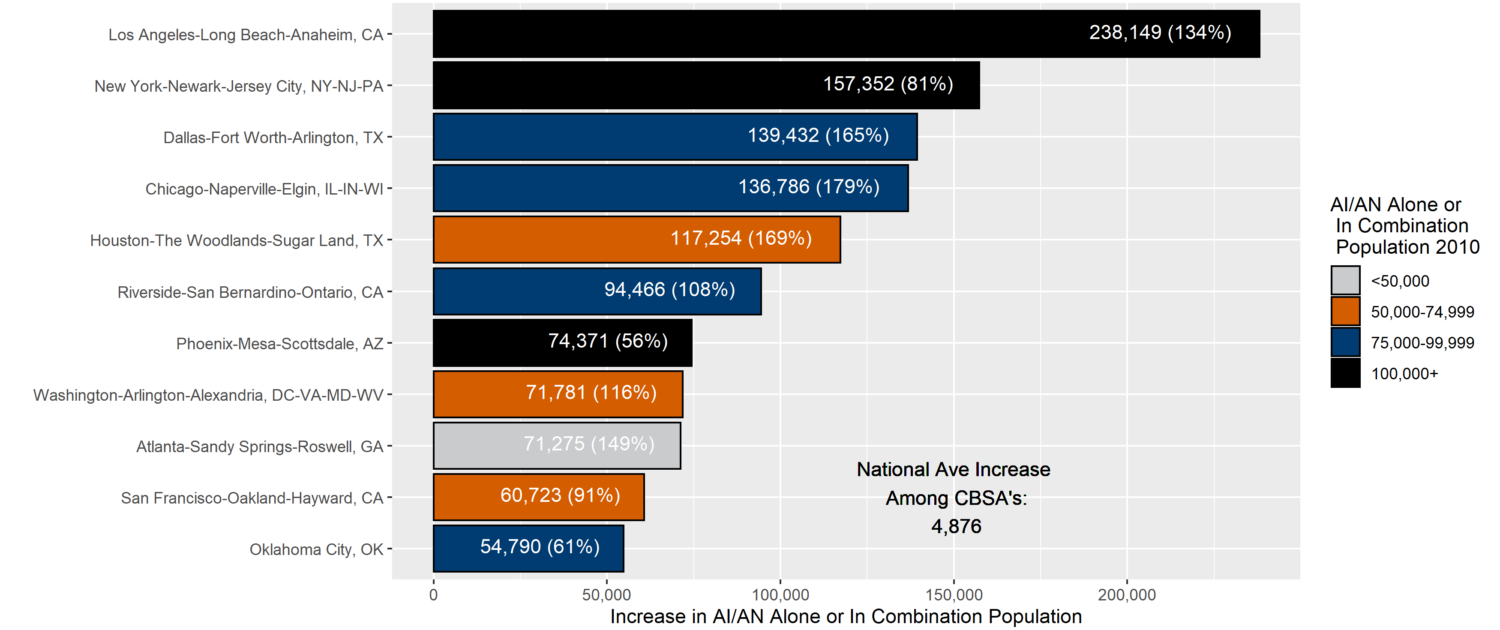
In thirty-eight Core Base Statistical Areas (CBSAs), the AI/AN population increased by more than 20,000 people, with the highest gain being Los Angeles-Long Beach-Anaheim, followed by New York City-Newark-Jersey City, Dallas-Fort Worth-Arlington, and Chicago-Naperville-Elgin (Figure 1). This includes areas like New York City or Phoenix which already had a high urban AI/AN population in 2010, as indicated by the color of the bar. Some of the largest increases in population are in areas with little to no access to Indian Health Service, Tribal or Urban Indian Health Program facilities. Of the top ten areas by growth, Washington DC, Houston, and Atlanta which do not have a UIO there.
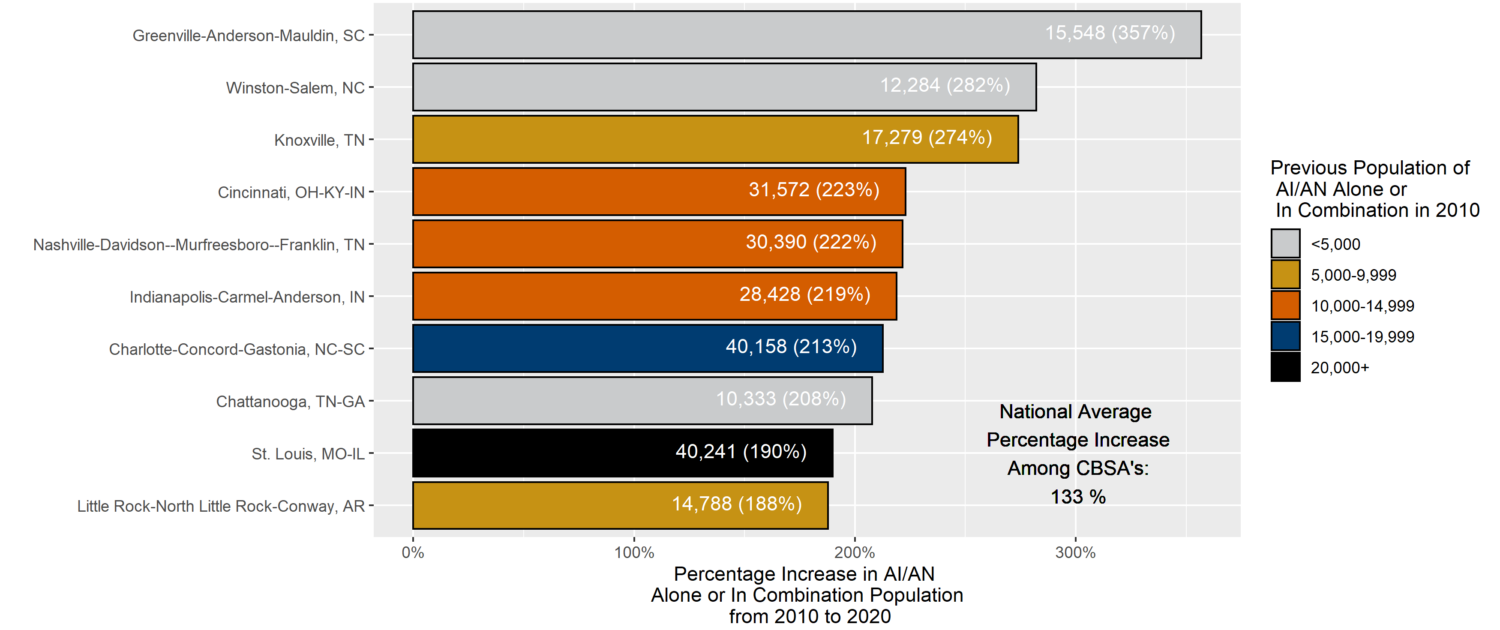
In 518 CBSAs, the AI/AN population more than doubled. Interestingly, cities with the largest percentage increase in AI/AN population were all located in the south and the lower Midwest, where there are very few I/T/U facilities to support these growing urban AI/AN communities (Figure 2).
Figure 1: Top Ten Core Base Statistical Areas (CBSA’s) with the largest increase in AI/AN population from 2010 to 2020.
Figure 2: Top Ten Core Base Statistical Areas (CBSA’s) with the largest percentage increase in AI/AN population from 2010 to 2020 (with an increase was greater than 10,000 people).
Redistricting data is initial, with more detailed data on tribal affiliation forthcoming. The quality of the 2020 census also has not yet analyzed, and it remains undetermined what factors or combination of factors drive these observed trends. Nevertheless, it is important to highlight and discuss the regional growth of urban people identifying their race as AI/AN during the 2020 Census. Nationally, the Urban AI/AN population has grown tremendously in the past 10 years – over 10 times the percentage increase of the general population – with even more population growth within different cities and regions. In order for the federal government to meet its trust responsibility, healthcare funding for AI/AN people must acknowledge and meet this service need.
By Alexander Zeymo and Andrew Kalweit, posted on October 8, 2021.


