
Urban American Indian Undercount in the 2020 Census Went Underreported
Figure 1: Interactive National Map of Urban Indian Organization (UIO) Service Areas showing the Distribution of American Indian/Alaska Natives (AI/AN) and Self-Response Rate (SRR)
There have been concerns for growing inaccuracies in the U.S. Decennial Census in recent decades, particularly affecting marginalized communities. The most recent Decennial Census seems to have continued these inaccuracies, undercounting Black, Hispanic and American Indian and Alaska Native (AI/AN) peoples.i,ii The undercount for the AI/AN population living on reservation in the 2020 Decennial Census was reported in several publications after Census results were first announced by the Census Bureau .iii,iv, v,vi However, the undercount of the off-reservation AI/AN population, which includes urban AI/AN people, did not receive similar coverage by the mainstream media, despite similar effects. Failure to report on the undercount of the urban AI/AN population contributes to the existing research gap and may impact federal health policy relating to this population.
Background: Undercount on Reservations and in the U.S. Balance
After the Decennial Census, the U.S. Census Bureau conducted a Post-Enumeration Survey, to estimate the accuracy of the census, and estimating over- or undercount by state and demographic groupvii. In a demographic analysis of the undercount, the U.S. Census separated the nation’s AI/AN population into three groups:viii
- “On Reservation”: “the AI/AN population living within a federally or state recognized Indian reservation”
- “American Indian Areas Off Reservation”: “populations of AI/AN on lands not considered a reservation” This includes trust lands, tribal jurisdiction statistical areas, tribal designated statistical areas, Alaska Native Regional Corporations, and Alaska Native village statistical areas.
- “Balance of the United States”: everything else, including the many large cities across the county.
The Census undercount report found that in 2020, there was a statistically significant undercount of AI/AN people in both “On Reservation” and “Balance of the United States” populations. This undercount is shown in Table 4 from the U.S. Census Demographic Analysis which is provided in Figure 2 below. We recognize that “Balance of the United States” is not precisely the same as urban areas, since it also includes many non-urban areas that are not part of Tribal lands. This adds another layer of inaccuracy, since inaccuracies specific to the urban AI/AN population count is hidden within the “Balance of the United States” undercount. The majority of AI/AN people (over 70%) live in the “Balance of the United States”, including in the 38 metropolitan areas where Urban Indian Organizations (UIOs) are present.ix, x
Figure 2: Net Coverage Error Rates for Household Populations in the United States by Race and Hispanic Origin from the U.S. Census Post-Enumeration Survey Demographic Analysis.
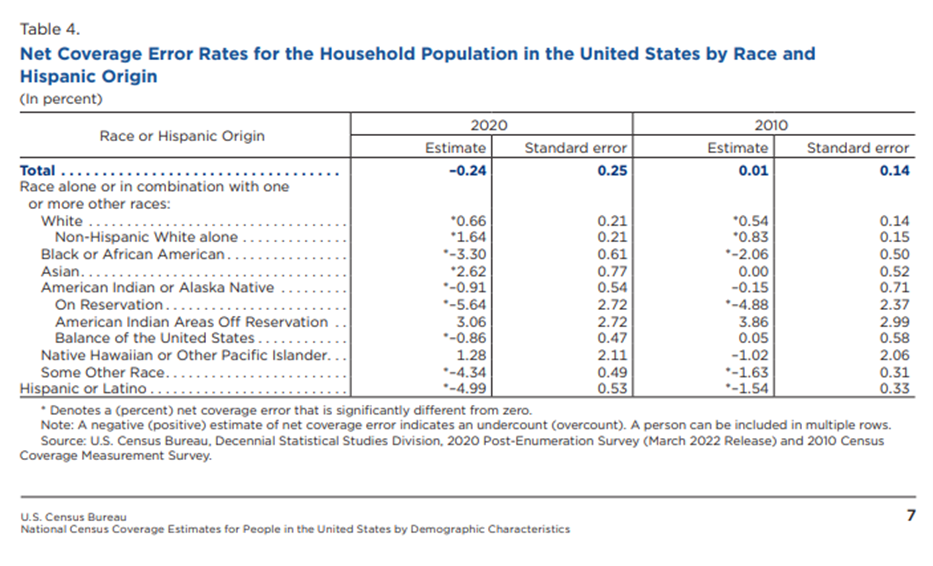
Source: U.S. Census Bureau: Decennial 2020 Census: Post-Enumeration Survey Demographic Analysis.
The undercount for the “Balance of the United States” AI/AN population, which includes urban AI/AN populations, was mostly unreported by mainstream media sources. These sources pointed to the large undercount in the African-American, Hispanic, and the AI/AN population living “On Reservation”, but they failed to mention the statistically significant undercount among the AI/AN population in the “Balance of the United States”. In fact, one institution published “the American Indian or Alaska Native population not living on reservations was not miscounted.” This statement is incorrect, since the U.S. Census Demographic Analysis showed a statistically significant undercount of 0.9% in the AI/AN population in the “Balance of the United States” in 2020.xi This dismissal continues the erasure of the urban AI/AN population in data, news, and the consciousness of the public.
Census Enumeration Process: Self-Response Rate
To understand better how undercounting can occur we must take a closer look at the process of collecting data for the Census. The first stage of the Census is the self-response operations. This is when each household in the country is sent the US Census survey to fill out and return. The 2020 Decennial Census was the first-time respondents were allowed to return their census online instead of by phone or mail. Self-response is considered the “gold standard” of census taking because of its high accuracy.xii Some areas followed an Update/Enumerate (UE) method, where census enumerators were sent to interview households and update the address frame, or an Update/Leave (UL), where the enumerator goes to the location to update the address frame and then leaves census forms there. These areas included Remote Alaska areas and American Indian areas that requested for initial interviews to be done by an enumerator. After the period for self-response expires, the U.S. Census undergoes Non-Response Follow-Up (NRFU) operations which include sending enumerators to confirm vacancies, conduct in person interviews and using administrative records to impute demographic information about incomplete enumerations.xiii Despite efforts to improve accurate coverage during NRFU, enumerations from NRFU increase the chance of erroneous enumeration and omission compared to enumerations from the self-response phase.xiv
NCUIH Self-Response Rate Analysis
NCUIH analyzed the cumulative self-response rate (SRR) by census tract within the 38 cities served by UIOs and compared it against the AI/AN population in those tracts.xv,xvi We chose to limit our analysis to UIO service areas in order to focus on an urban AI/AN population with access to the culturally competent healthcare and community services provided by these UIOs. In this analysis, we combined those who identified as AI/AN alone as well as those that identified as AI/AN in combination with other races, henceforth referred to as “AI/AN alone or in combination”. To protect identification of AI/AN people, census tracts with fewer than 20 AI/AN people were excluded. Additionally, census tracts where the population was less than 0.5% AI/AN were also excluded for the same reason. Finally, to respect the sovereignty and privacy of Tribes with land in UIO service areas, census tracts with American Indian land in them were also excluded. In all, 20,423 census tracts were included in our analysis, while 1,228 census tracts were excluded for any of the previously listed reasons.
In our analysis we used graphs and linear regression to determine the association of AI/AN population concentration and SRR, for all UIO service areas aggregated as well as for each service area separately. We also used maps to show the distribution of AI/AN population within these UIO service areas, and the relationship with SRR.
SRR Results
Our regression analysis indicated a statistically significant negative association between AI/AN population and SRR. For every 1% increase in the AI/AN percentage of the tract population, the self-response rate decreases by 0.68 percentage points.
In the data tool below, Figure 3, a scatter plot with a line-of-best fit is plotted relating the percentage of AI/AN people and the SRR for each UIO service area. Each point in the scatter plot represents each census tract. You can change the UIO service areas by clicking on the arrow tabs at the top of the tool. Additionally, the data tool includes a drop-down menu to select a specific service area of interest.
Figure 3: Interactive Graph showing Association between AI/AN Population Concentration and SRR in UIO Service Areas
The map data tool at the top of the page, Figure 1, can be used to explore service areas in more detail.
- To view one of the infocards about a particular UIO service area, click on one of the circles where a UIO is located, and the tool will zoom into a card showing information about self-response rates and the AI/AN population in the service area.
- Each card includes the total AI/AN alone or in combination population in that area as of the 2020 Decennial Census as well as two maps, one showing the self-response rates by census tract and another showing the AI/AN population percentage by census tracts.
- Census tracts that were excluded in the analysis were not shown in these maps.
- The card also includes the average self-response rate for the tracts in the area in addition to the percentage of tracts with low SRR (<60%) and the percentage with high SRR (80%+).
- Each card includes the percentage of the AI/AN population that lives in the low SRR tracts and the percentage that live in the high SRR tracts.
- There are two hidden zoom areas for western Montana and northern California to select a UIO more precisely in those regions.
- To return to the entire map, click on the “home” button on the right side of the data tool, or scroll out with the mouse wheel.
- The data tool also includes a glossary of terms and data sources used to do this analysis at the bottom right of the “home” map.
In sixteen UIOs service areas, AI/AN population is more strongly associated with lower self-response rate, which you can see where the percentage of AI/AN population in low SRR tracts is higher than the tracts with an SRR less than 60%.
Discussion of NCUIH SRR Analysis Results
Others have demonstrated the relationship between low self-response rate and increased inaccuracy in the U.S. Census.xii,xvii,xviii Between the significant undercount of AI/AN people in cities and the underreporting of the undercount, the urban AI/AN community remains partially hidden from the general population’s and decision maker’s view. The implications of this undercount to the urban AI/AN community are many, including inaccurate reference data needed to inform survey design aiming to record urban AI/AN respondents.19xix This will only exacerbate the gap in research on this overlooked population. Additionally, this undercount could jeopardize health in the population, as federal spending calculations, including the budget for the Indian Health Service, are affected.xx,xxi,xxii
As the U.S. Bureau of the Census undergoes its planning of the 2030 Census procedures, we need to have voices and evidence showing the arbitrary inequities in enumeration. Research such as this shows the need for changes, as we cannot forget that urban AI/AN people exist and thrive, and issues and inequities that affect this community cannot be overlooked.
i US Census Bureau Newsroom Archive. (2012, May) Census Bureau Releases Estimates of Undercount and Overcount in the 2010 Census. U.S. Census Bureau. https://www.census.gov/newsroom/releases/archives/2010_census/cb12-95.html#:~:text=The%202010%20Census%20undercounted%202.1%20percent%20of%20the,0.7%20percent%20was%20not%20statistically%20different%20from%20zero.
ii Kreiger, N (2019, Aug). The US Census and the People’s Health: Public Health Engagement from Enslavement and “Indians not Taxed” to Census Tracts and Health Equity (1780-2018). American Journal of Public Health: 109(8):1092-1100. doi: 10.2105/AJPH.2019.305017.
iii Wines, M. and Cramer M. (2022) “2020 Census Undercounted Hispanics, Black and Native American Residents.” The New York Times. https://www.nytimes.com/2022/03/10/us/census-undercounted-population.html.
iv Schneider, M. (2022) “Some Minority Groups Missed at Higher Rates in 2020 US Census.” AP News. https://apnews.com/article/us-census-bureau-hispanics-census-2020-d284cdbe32fd9ad1a1ad3794cd4d0362.
v Wang, H.L. (2022) “The 2020 census had big undercounts of Black People, Latinos and Native Americans.” National Public Radio. https://www.npr.org/2022/03/10/1083732104/2020-census-accuracy-undercount-overcount-data-quality.
vi Ax, J. (2022) “U.S. Census Undercounted Latinos, Black People and Native Americans.” Reuters. https://www.reuters.com/world/us/us-census-undercounted-black-people-latinos-native-americans-officials-say-2022-03-10/.
vii Marra, E., and Kennel, T. (2022, Mar) Source and Accuracy of the 2020 Post-Enumeration Survey Person Estimates. U.S. Census Bureau. https://www2.census.gov/programs-surveys/decennial/coverage-measurement/pes/2020-source-and-accuracy-pes-estimates.pdf
viii Khubba, S., Heim, K., and Hong, J. (2022) “National Census Coverage Estimates for People in the United States by Demographic Characteristics; 2020 Post-Enumeration Survey Estimation Report.” U.S. Census Bureau. https://www2.census.gov/programs-surveys/decennial/coverage-measurement/pes/national-census-coverage-estimates-by-demographic-characteristics.pdf.
ix Urban Indian Health Institute (2023) Urban Indian Health. Urban Indian Health Institute. https://www.uihi.org/urban-indian-health/#:~:text=7%20out%20of%2010%20American%20Indians%20and%20Alaska,Indians%20and%20Alaska%20Natives%20live%20in%20urban%20areas.
x Whittle, J (2017, Sep) Most Native Americans Live In Cities, not Reservations. Here are their Stories. The Guardian. https://www.theguardian.com/us-news/2017/sep/04/native-americans-stories-california.
xi Benson, S. (2022) “Census undercounted Black people, Hispanics, and Native Americans in 2020”.Politico. https://www.politico.com/news/2022/03/10/2020-census-undercount-black-people-hispanics-native-americans-00016138.
xii Salvo, J.J., Jacoby, A., and Lobo, A.P. (2020) Census 2020: Why Increasing Self-Response is Key to a Good Count. Significance. https://academic.oup.com/jrssig/article/17/1/30/7029480.
xiii Fontenot, A.J. (2022, Feb) 2020 Census Operational Plan: A New Design for the 21st Century. U.S. Census Bureau. https://www2.census.gov/programs-surveys/decennial/2020/program-management/planning-docs/2020-oper-plan5-and-memo.pdf.
xiv O’Hare, W.P. (2020) Are Self-Participation Rates Predictive of Accuracy in the U.S. Census? International Journal of Social Science Studies: 8(6). https://doi.org/10.11114/ijsss.v8i64967.
xv CRVRDO. (2021) US Census PL 94-171 Redistricting Data. United States Census Bureau. https://www.census.gov/programs-surveys/decennial-census/about/rdo/summary-files.html.
xvi United States Census Bureau. (2021) Decennial Census Self-Response Rates (2020, 2010). United States Census Bureau. https://www.census.gov/data/developers/data-sets/decennial-response-rates.html.
xvii Center for Urban Research (2020). “Census Self-Response Rates Mapped: 2000, 2010, 2020.” The Graduate Center: City University of New York. https://www.gc.cuny.edu/center-urban-research/research-projects/census-maps.
xviii Center for Urban Research (2020). “HRC 2020: Hard-to-Count Maps.” The Graduate Center: City University of New York. https://www.censushardtocountmaps2020.us/?latlng=40.01079%2C-98.08594&z=4&promotedfeaturetype=states&baselayerstate=3&rtrYear=sR2020latest&infotab=info-rtrselfresponse&filterQuery=false.
xix Jacobson, L. (2020) “Could an Undercounted 2020 Census Affect a Range of Federal Statistics.” Politifact. https://www.politifact.com/article/2020/aug/26/could-undercounted-2020-census-afflict-range-feder/#:~:text=Problems%20with%20the%20basic%20population%20count%20could%20have,spending%2C%20education%2C%20income%2C%20inequality%2C%20and%20poverty%2C%20experts%20said.
xx Macagnone, M (2020, June) Census Trying to Fix History of Undercounting Minorities. Roll Coll: Policy. https://rollcall.com/2020/06/18/census-trying-to-fix-history-of-undercounting-minorities/.
xxi Hale, K (2020, Mar) Being Undercounted in the U.S. Census Costs Minority Communities Millions of Dollars. Forbes. https://www.forbes.com/sites/korihale/2020/03/24/being-undercounted-in-the-us-census-costs-minority-communities-millions-of-dollars/?sh=5f24d6ce3aa0.
xxii George Washington Institute of Public Policy (2020, Apr) Counting for Dollars 2020: The Role of the Decennial Census in the Geographic Distribution of Federal Funds. The George Washington University. https://gwipp.gwu.edu/counting-dollars-2020-role-decennial-census-geographic-distribution-federal-funds.


Leave a Reply
Want to join the discussion?Feel free to contribute!