
Life Expectancy Rates for American Indian and Alaska Native People Dropped Drastically During the COVID-19 Pandemic
Overview:
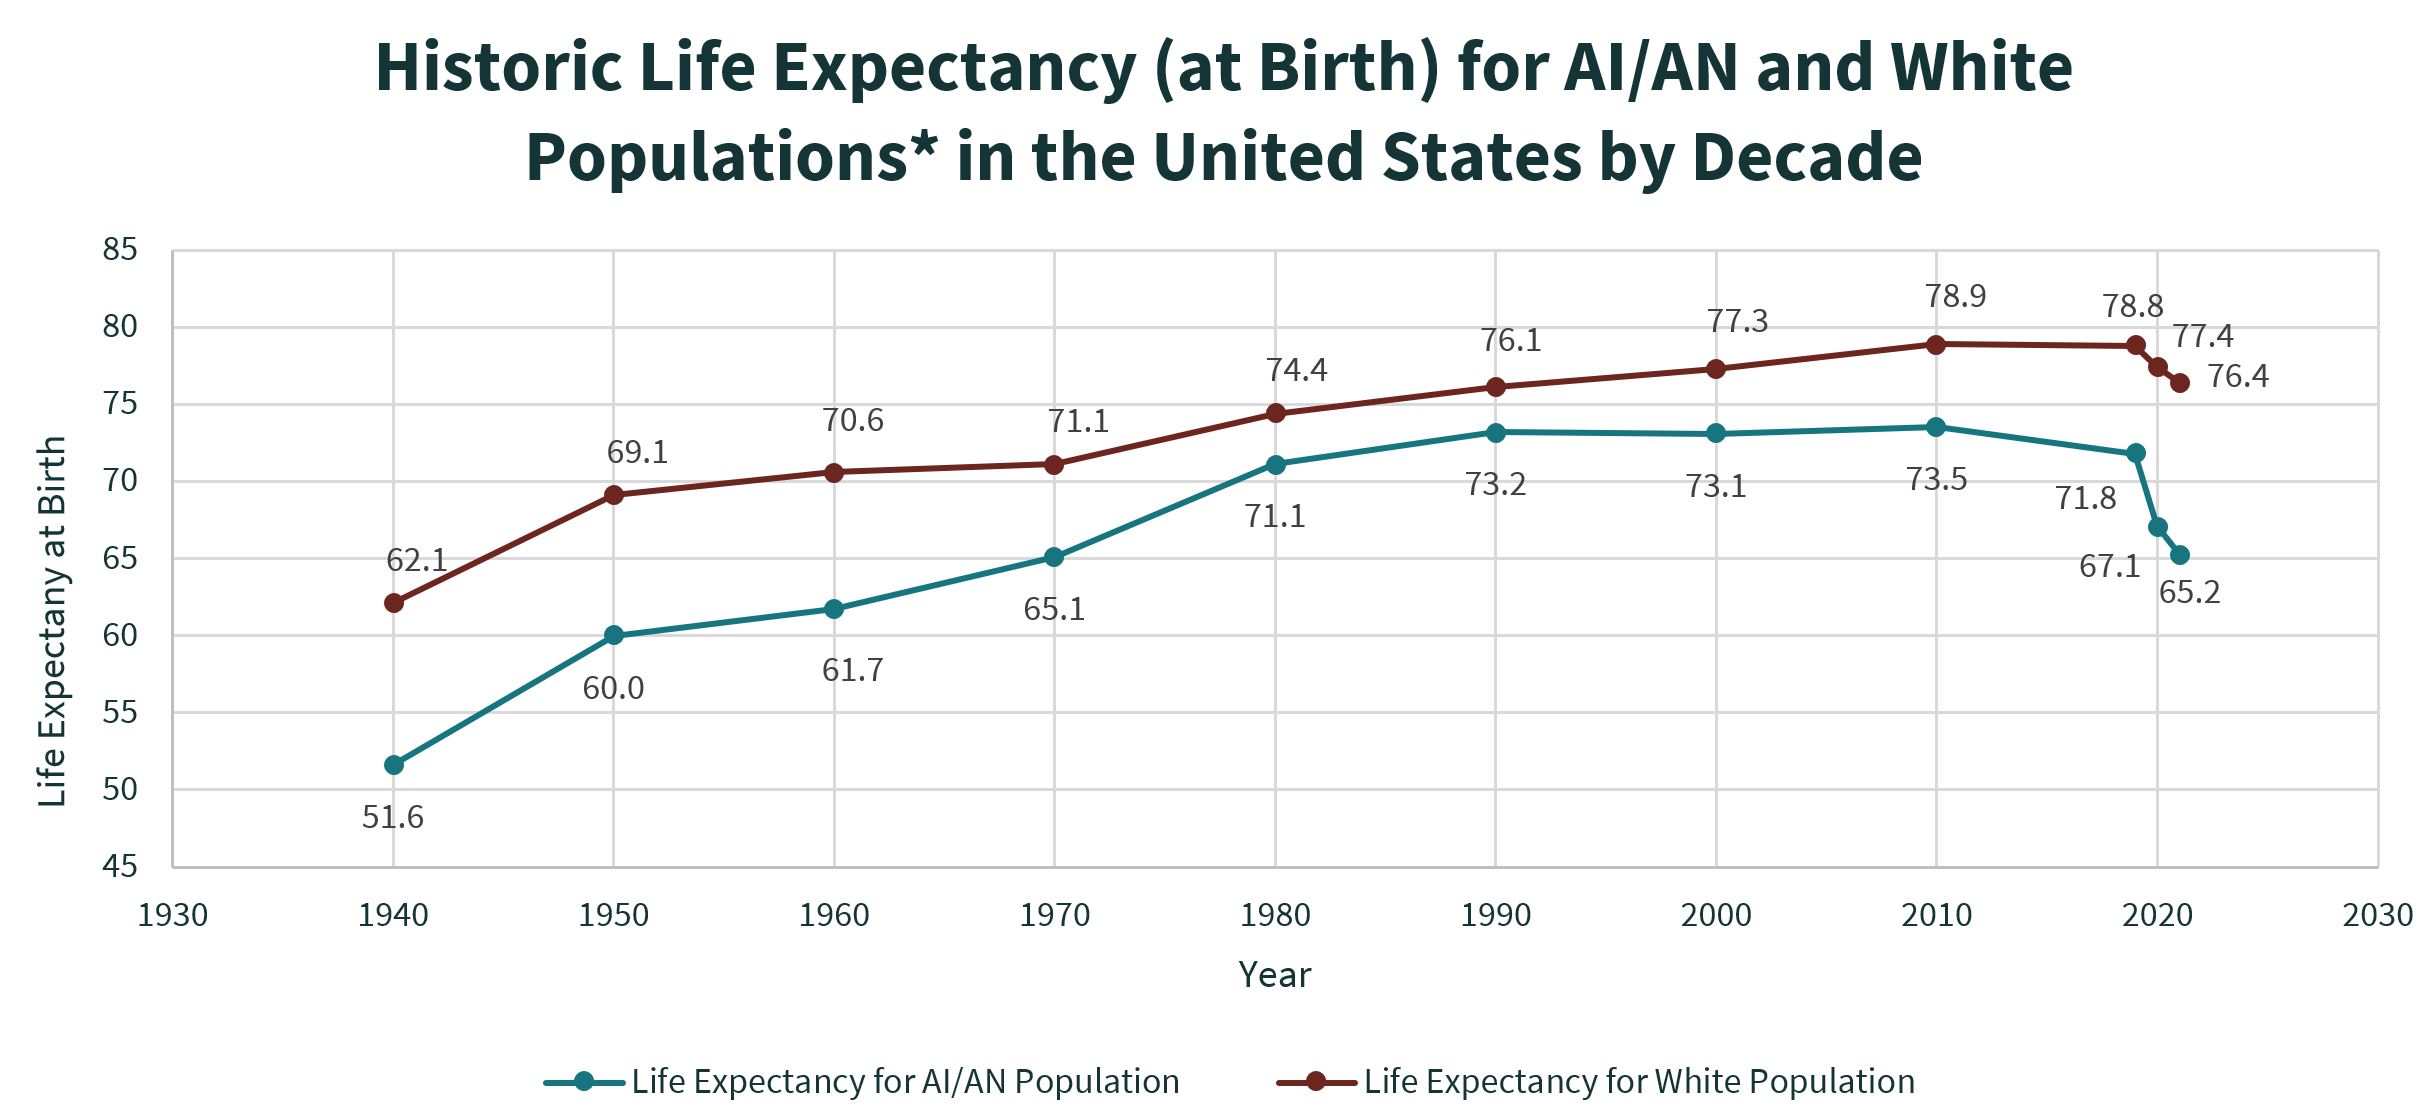
COVID-19 has impacted life expectancy across the globe, reversing trends of life expectancy gains.1,2 American Indian and Alaska Native (AI/AN) people have lower life expectancies than the non-Hispanic White (NHW) population. While the gap between life expectancies for the AI/AN and White populations decreased in the late 20th century and early 21st century, during the COVID-19 Pandemic, the difference in AI/AN and NHW life expectancies grew by over ten years. When looking at the top-of-the-decade life expectancies for each population, a 10+ year difference in life expectancy was last seen between the two populations in 1940.
Life Expectancy Definition:
Life expectancy at birth is the calculated estimate of years a given population (i.e., sex, race/ethnicity, place of residence, etc.) is expected to live if born in the given year, based on current mortality and life trends.3
Life expectancy for the AI/AN population from 1940-1990 was calculated using Indian Health Service (IHS) patient records to calculate life expectancy, so those decades would include single-race or combination-race IHS patients in the given timeframe. From 2000-2021, life expectancy for the AI/AN population was measured using National Vital Statistics System (NVSS) Centers for Disease Control and Prevention (CDC) data, which only included the single-race-identified AI/AN population.
Explanation of Data:
Historically, AI/AN people experienced significantly lower life expectancies than NHW people in the United States. Currently, the life expectancy for an AI/AN person born in 2021 is 65.2 years, 11.2 years less than an NHW person’s life expectancy born in the same year (76.4 years).4 The life expectancy for AI/AN people in 2021 was comparable to the overall life expectancy for Americans during the first two years of US military involvement in World War II (1942 and 1943).5,6
- 2021 -> AI/AN pop. 65.2 years4
- 1942 -> All Races/All Sexes US 66.2 years5
- 1943 -> All Races/All Sexes US 63.3 years5
In addition, within the inaugural year of the COVID-19 pandemic, a universal decline in life expectancies was observed across the US. However, the decrease was particularly larger within the AI/AN community, where life expectancy decreased by nearly five years between 2019 and 2020. In contrast, the life expectancy for NHW populations diminished by approximately 1.5 years during the same period. This stark contrast underscores the profound inequities experienced among AI/AN people in the United States, highlighting the catastrophic repercussions of the COVID-19 pandemic on Native communities. Table 1 showcases the historic gap in life expectancies for AI/AN people compared to NHW people in the United States.
Table 1.
Historic Life Expectancy (at Birth) for AI/AN Population Compared to NHW Population
| Year | Life Expectancy for AI/AN | Life Expectancy for NHW |
| 1940 | 51.6 y/o7 | 62.1 y/o7 |
| 1950 | 60.0 y/o7 | 69.1 y/o7 |
| 1960 | 61.7 y/o7 | 70.6 y/o7 |
| 1970 | 65.1 y/o7 | 71.1 y/o7 |
| 1980 | 71.1 y/o7 | 74.4 y/o7 |
| 1990 | 73.2 y/o | 76.1 y/o8 |
| 2000 | 73.1 y/o9 | 77.3 y/o10 |
| 2010 | 73.5 y/o9 | 78.9 y/o10 |
| 2019 | 71.8 y/o9 | 78.8 y/o4 |
| 2020 | 67.1 y/o4 | 77.4 y/o4 |
| 2021 | 65.2 y/o4 | 76.4 y/o4 |
Note: The table includes a summary of AI/AN and NHW populations’ life expectancy (at birth) for all sexes data by the decade in the same table. See Limitations of Data for more information on population.
Figure 1.
Historic Life Expectancy (at Birth) for AI/AN and White Populations in the United States
Note: See Table 1 for more information on population data for data sources for each decade.
Limitations of the Data:
Life data tables for the AI/AN population were not produced by the CDC/US Census Bureau until 2019.8 Much of the life expectancy data comes from IHS and then is linked by researchers with data from NVSS, the US Census Bureau, or other government agencies, to collect an estimate on the AI/AN population’s life expectancy for a given year. For example, NVSS grouped different races/ethnicities into “White” and “Nonwhite” until 1969.11 Historic life expectancies for the Black population had to use “Nonwhite” data until additions were made to the racial categories for vital statistics data in 1970.12 Despite the addition of “Black” as a racial category in the ‘70s, the non-Hispanic AI/AN demographic was not included as a racial category for the NVSS United States Life Tables until the publication of the United States Life Tables, 2019 in 2022.13 However, the United States Life Tables, 2019 only include single-race-identified AI/AN people due to the 1997 Office of Management and Budget’s (OMB) standards on classifications for race and ethnicity.13–15 It is important to note that in 2019, the National Center for Health Statistics published a study in the Mortality and Morbidity Weekly Report that sounded the alarm of a Public Health Emergency for the existing health disparities within the AI/AN population, stating,
“My hope is that policymakers and health care providers recognize the very large disparity between this population and all other populations in this country… they have the worst health profile and mortality risk in this country. So, I would call it an emergency. It is something that should be taken very seriously.” 16
The study also showed that AI/AN people have higher mortality rates for most of the top leading causes of death and in most age groups compared with White, Black, and Hispanic people.
Specifically, the data in Table 1 for the life expectancy for AI/AN people from 1940-1990 used IHS records to calculate AI/AN life expectancy, while the NHW life expectancy used census data. The IHS data only uses a sample of AI/AN people who received services or care from an IHS facility. The IHS user population is not representative of all AI/AN people within the United States in that timeframe or in another timeframe.7,17
2000-2021 data for the AI/AN population use a more inclusive population from NVSS that encompasses more AI/AN people compared to IHS datasets, which are inclusive of AI/AN-identified people who do not receive care from IHS. However, due to NVSS following OMB standards for reporting, only single-race-identified AI/AN people were included in the AI/AN population.4,18
Additionally, death records for AI/AN people are frequently misclassified for race. There is continuous documentation of racial misclassification of AI/AN people in death certificates. This racial misclassification would undercount the mortality rate of AI/AN people due to their deaths being labeled as another race/ethnicity and counted towards that indicated race. Given the limited data publicly available on the AI/AN population, the NCUIH Research and Data Team could not account for the misclassification of the death rate. NVSS life tables did try to account for racial misclassification by linking death records to the 2010 decennial census.14 However, the census underreports AI/AN people, and thus, misclassification could still persist in NVSS life expectancy calculations.19
Works Referenced:
- Soucheray, S. WHO: COVID-19 pandemic reversed decade of life expectancy gains | CIDRAP. Center for Infectious Disease Research and Policy, University of Minnesota https://www.cidrap.umn.edu/covid-19/who-covid-19-pandemic-reversed-decade-life-expectancy-gains (2024).
- World Health Organization. COVID-19 eliminated a decade of progress in global level of life expectancy. World Health Organization https://www.who.int/news/item/24-05-2024-covid-19-eliminated-a-decade-of-progress-in-global-level-of-life-expectancy (2024).
- Centers for Disease Control and Prevention National Center for Health Statistics. NVSS – Life Expectancy. National Center for Health Statistics https://www.cdc.gov/nchs/nvss/life-expectancy.htm (2023).
- Arias, E., Tejada-Vera, B., Kochanek, K. & Ahmad, F. Provisional Life Expectancy Estimates for 2021. https://www.cdc.gov/nchs/data/vsrr/vsrr023.pdf (2022) doi:10.15620/cdc:118999.
- Bastian, B., Tejada-Vera, B. & Arias, E. Mortality Trends in the United States, 1900-2018. National Center for Health Statistics https://www.cdc.gov/nchs/data-visualization/mortality-trends/index.htm (2020).
- Library of Congress. World War II | Great Depression and World War II, 1929-1945 | U.S. History Primary Source Timeline | Classroom Materials at the Library of Congress | Library of Congress. Library of Congress, Washington, D.C. 20540 USA https://www.loc.gov/classroom-materials/united-states-history-primary-source-timeline/great-depression-and-world-war-ii-1929-1945/world-war-ii/.
- Snipp, C. M. American Indians: The First of This Land. (Russell Sage Foundation, 1989).
- Products – Life Tables – Decennial Tables – 1989-1991. https://www.cdc.gov/nchs/products/life_tables/89liftbl.htm (2019).
- Dwyer-Lindgren, L. et al. Life expectancy by county, race, and ethnicity in the USA, 2000–19: a systematic analysis of health disparities. The Lancet 400, 25–38 (2022).
- Arias, E. United States Life Tables, 2010. https://www.cdc.gov/nchs/data/nvsr/nvsr63/nvsr63_07.pdf (2014).
- Grove, R. & Hetzel, A. Vital Statistics Rates in the United States 1940-1960. https://www.cdc.gov/nchs/data/vsus/vsrates1940_60.pdf (1968).
- Sanghi, S. & Smaldone, A. The Evolution of the Racial Gap in U.S. Life Expectancy. https://www.stlouisfed.org/on-the-economy/2022/january/evolution-racial-gap-us-life-expectancy (2022).
- Arias, E. & Xu, J. United States Life Tables, 2019. National Vital Statistics Reports 70, (2022).
- Arias, E., Xu, J. & Kochanek, K. United States Life Tables, 2021. National Vital Statistics Reports: From the Centers for Disease Control and Prevention, National Center for Health Statistics, National Vital Statistics System 72, (2023).
- Arias, E. & Xu, J. United States Life Tables, 2020. National Vital Statistics Reports 71, (2022).
- Arias, E., Xu, J., Curtin, S., Bastian, B. & Tejada-Vera, B. Mortality Profile of the Non-Hispanic American Indian or Alaska Native Population, 2019. Natl Vital Stat Rep 70, 1–27 (2021).
- YOUNG, T. K. Recent health trends in the Native American population. Population Research and Policy Review 16, 147–167 (1997).
- Life expectancy by county, race, and ethnicity in the USA, 2000–2019: a systematic analysis of health disparities. Lancet 400, 25–38 (2022).
- Zeymo, A. Urban American Indian Undercount in the 2020 Census Went Underreported. National Council of Urban Indian Health Research Blog https://ncuih.org/2023/08/28/urban-american-indian-undercount-in-the-2020-census-went-underreported/ (2023).


